|
Specification
Surface Texture Parameters
There are three types of surface texture profiles currently defined in the ISO standards:
-
Primary profile (ISO 3274–1996)[ 2]. A primary profile has had the nominal form removed and has been Ls filtered. The primary profile is the basis for evaluation of the primary profile parameters. The sampling length lp is numerically equal to the evaluation length.
-
Roughness profile (ISO 4287–1997)[ 4]. A profile derived from the primary profile by suppressing the long wave component using the short wave Gaussian profile filter with a cut-off wavelength value Lc. The roughness profile is the basis for evaluation of the roughness profile parameters. The sampling length lr is numerically equal to the cut-off wavelength Lc.
-
Waviness profile (ISO 4287–1997)[ 4]. A profile derived by suppressing the long-wave component using the "profile filter Lf", and suppressing the short-wave component using the long-wave Gaussian profile filter with a cut-off wavelength value of Lc. The waviness profile is the basis for evaluation of the waviness profile parameters. The sampling length lw is numerically equal to the cut-off wavelength Lf.
Note: No current ISO standard currently defines the "profile filter Lf". Current industrial practice therefore ignores this filter step and uses a sampling length lw equal to the cut-off wavelength Lc.
Primary Profile
For the SoftGauge data the assumptions are that the form has been removed, the data has already been Ls filtered, and it is equally spaced. In other words the SoftGauge describes a primary profile with equally spaced data points. Thus to obtain the primary profile no action is necessary.
Calculation of the P parameters is over the sample length lp, that is all the data points in the SoftGauge.
Roughness Profile
To obtain the roughness profile the primary profile is first filtered using the short wave Gaussian profile filter with a cut-off wavelength value Lc. This will result in the loss of one sampling length lr at the beginning and one sampling length lr at the end of the profile.
The remaining profile is then partitioned into adjacent segments. Apart from possibly the last segment at the end of the profile, each segment is equal in length to the sampling length. If the last segment is not equal in length to the sampling length then it is removed. The resulting profile is called the roughness profile
Calculation of the R parameters is over a previously specified number of segments, which here is called the Calculation Number CN. The default CN given in ISO 4288-1996[5] is five. If the roughness profile contains more than CN segments then only the first CN segments are used in subsequent calculations. If the roughness profile contains less than CN segments then all segments are used in subsequent calculations together with a warning stating how many segments were actually used.
Waviness Profile
The waviness profile is not well defined in current ISO standards. The following represents current industrial practice of ignoring the "profile filter Lf" step and using a sampling length lw equal to the cut-off wavelength Lc.
To obtain the waviness profile the primary profile is first filtered using the long wave Gaussian profile filter with a cut-off wavelength value Lc. This will result in the loss of one sampling length lw at the beginning and one sampling length lw at the end of the profile.
The remaining profile is then partitioned into adjacent segments. Apart from possibly the last segment at the end of the profile, each segment is equal in length to the sampling length. If the last segment is not equal in length to the sampling length then it is removed. The resulting profile is called the waviness profile
Calculation of the W parameters is over a previously specified number of segments, which here is called the Calculation Number CN. There is no default CN given in current ISO standards. Current industrial practice uses five as the default CN. If the waviness profile contains more than CN segments then only the first CN segments are used in subsequent calculations. If the waviness profile contains less than CN segments then all segments are used in subsequent calculations together with a warning stating how many segments were actually used.
Parameter definitions
ISO standards define surface texture parameters in terms of a continuous profile. In practice measured surface texture data are not continuous but take discrete values. It has been found (see Brennan 2004)[8] that changing the continuous definition "directly" to a discrete form (replacing integrals to summations etc.) can lead to unacceptable errors for a reference algorithm. Brennan (2004)[8] recommended the following points as improvements over the “direct” discretisation method:
• The need to include implied mean line crossing points simply by linearly interpolating the data where these occur and provide each profile peak or valley element with calculated boundary values.
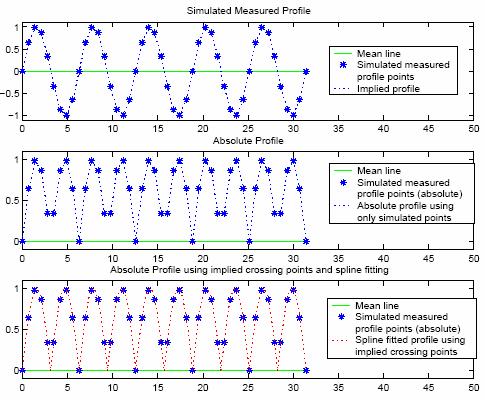
Figure 1: Example where a larger error for Ra is obtained using the absolute profile compared to the absolute profile
that uses interpolation beforehand to determine the mean line crossing points
Brennan et. al. (2004)[8] recommends using a piecewise natural cubic spline to interpolate through the discrete data values to ensure "a smooth approximation to the underlying function, without undue oscillation, in contrast to polynomial interpolation at all data points". No value of "smoothness" is used since this is interpolation between points. The continuous definitions, contained in ISO 4287-1997[4], can now be used to calculate parameter values from the interpolated piecewise natural cubic spline.
Amplitude Parameters (average of ordinates)
Name |
|
Type |
Amplitude (average) |
Calculated from |
Roughness Profile |
Description |
Arithmetical mean deviation of the assessed profile
Pa, Ra, Wa
arithmetic mean of the absolute ordinate values Z(x) within a sampling length |
Mathematical |
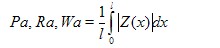
with l = lp, lr or lw according to the case.
|
Graphic |
|
Source |
ISO 4287 – 1996 section 4.2.1 |
|
Use a natural cubic spline to interpolate through the discrete data values.
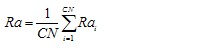
For each sample length i = 1, …, CN
Calculate
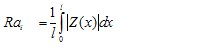
Calculate
|
Other Information |
1. Care required to determine crossover points. |
Name |
|
Type |
Amplitude (average) |
Calculated from |
Roughness Profile |
Description |
Root mean square deviation of the assessed profile
Pq, Rq, Wq
root mean square value of the ordinate values Z(x) within a sampling length |
Mathematical |
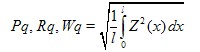
with l = lp, lr or lw according to the case.
|
Graphic |
|
Source |
ISO 4287 – 1996 section 4.2.2 |
|
Use a natural cubic spline to interpolate through the discrete data values.
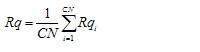
For each sample length i = 1, …, CN
Calculate
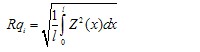 Calculate
 |
Other Information |
1. Alternative industrial definition over evaluation length rather than sampling length. |
Name |
|
Type |
Amplitude (average) |
Calculated from |
Roughness Profile |
Description |
Skewness of the assessed profile
Psk, Rsk, Wsk
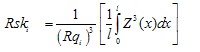
quotient of the mean cube value of the ordinate values Z(x) and the cube of Pq, Rq or Wq respectively, within a sampling length |
Mathematical |
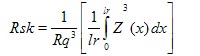
The above equation defines Rsk; Psk and Wsk are defined in a similar manner.
|
Graphic |
|
Source |
ISO 4287 – 1996 section 4.2.3 |
|
Use a natural cubic spline to interpolate through the discrete data values.
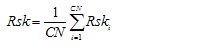
For each sample length i = 1, …, CN
Calculate
 Calculate
 |
Other Information |
1. Alternative industrial definition over evaluation length rather than sampling length. |
Name |
|
Type |
Amplitude (average) |
Calculated from |
Roughness Profile |
Description |
Kurtosis of the assessed profile
Pku, Rku, Wku
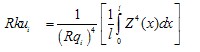
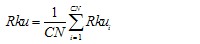
quotient of the mean quartic value of the ordinate values Z(x) and the fourth power of Pq, Rq or Wq respectively within a sampling length. |
Mathematical |
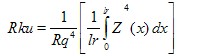
The above equation defines Rku; Pku and Wku are defined in a similar manner.
|
Graphic |
|
Source |
ISO 4287 – 1996 section 4.2.4 |
|
Use a natural cubic spline to interpolate through the discrete data values.
For each sample length i = 1, …, CN
Calculate
 Calculate
 |
Other Information |
1. Alternative industrial definition over evaluation length rather than sampling length. |
Amplitude Parameters (peak & valley)
Name |
|
Type |
Amplitude (peak & valley) |
Calculated from |
Roughness Profile |
Description |
Maximum profile peak height of the assessed profile
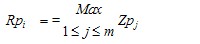
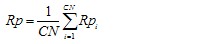
Pp, Rp, Wp
Largest profile peak height Zp within a sampling length |
Mathematical |
With m profile peaks in sampling length l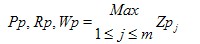
where Zpj is the height of the jth profile peak within the sampling length and l = lp, lr or lw according to the case. |
Graphic |
|
Source |
ISO 4287 – 1996 section 4.1.1 |
|
Use a natural cubic spline to interpolate through the discrete data values.
For each sample length i = 1,…, CN
Determine portions of the profile above the mean line, these are the profile peaks.
For each profile peak j= 1,…, m, determine the supremum height Zpj.
Calculate
Calculate
 |
Other Information |
1. Care required to determine crossover points for profile peaks
2. Care required at end of sampling lengths; see following note:
Note: The positive or negative portion of the assessed profile at the beginning or end of the sample length should always be considered as a profile peak or profile valley. When determining a number of profile elements over several successive sampling lengths the peaks and valleys of the assessed profile at the beginning or end of each sampling length are taken into account once only at the beginning of each sampling length. |
Name |
|
Type |
Amplitude (peak & valley) |
Calculated from |
Roughness Profile |
Description |
Maximum profile valley depth of the assessed profile
Pv, Rv, Wv
Largest profile valley depth Zv within a sampling length |
Mathematical |
With m profile valleys in sampling length l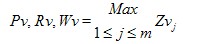
where Zvj is the depth of the jth profile valley within the sampling length and l = lp, lr or lw according to the case.
|
Graphic |
|
Source |
ISO 4287 – 1996 section 4.1.2 |
|
Use a natural cubic spline to interpolate through the discrete data values.
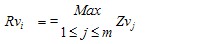
For each sample length i = 1,…, CN
Determine portions of the profile blow the mean line, these are the profile valleys.
For each profile valley j= 1,…, m, determine the supremum depth Zvj.
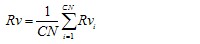
Calculate
Calculate
 |
Other Information |
1. Care required to determine crossover points for profile valleys
2. Care required at end of sampling lengths; see following note:
Note: The positive or negative portion of the assessed profile at the beginning or end of the sample length should always be considered as a profile peak or profile valley. When determining a number of profile elements over several successive sampling lengths the peaks and valleys of the assessed profile at the beginning or end of each sampling length are taken into account once only at the beginning of each sampling length. |
Name |
|
Type |
Amplitude (peak & valley) |
Calculated from |
Roughness Profile |
Description |
Maximum height of the assessed profile
Pz, Rz, Wz
Sum of height of the largest profile peak height Zp and the largest profile valley depth Zv within a sampling length. |
Mathematical |

all calculated over a sampling length
|
Graphic |
|
Source |
ISO 4287 – 1996 section 4.1.3 |
|
Calculate Rp and Rv over the appropriate number of sampling lengths and add the calculated values together.
|
Other Information |
|
Name |
|
Type |
Amplitude (peak & valley) |
Calculated from |
Roughness Profile |
Description |
Total height of the assessed profile
Pt, Rt, Wt
Sum of height of the largest profile peak height Zp and the largest profile valley depth Zv within an evaluation length. |
Mathematical |
all calculated over the evaluation length
|
Graphic |
|
Source |
ISO 4287 – 1996 section 4.1.5 |
|
Calculate Rp and Rv over the evaluation length and add the calculated values together.
|
|
